Make Your First Webmap
Create an interactive weather map with real-time data visualization and microcontroller integration
What You'll Need
Set Up Your Development Environment
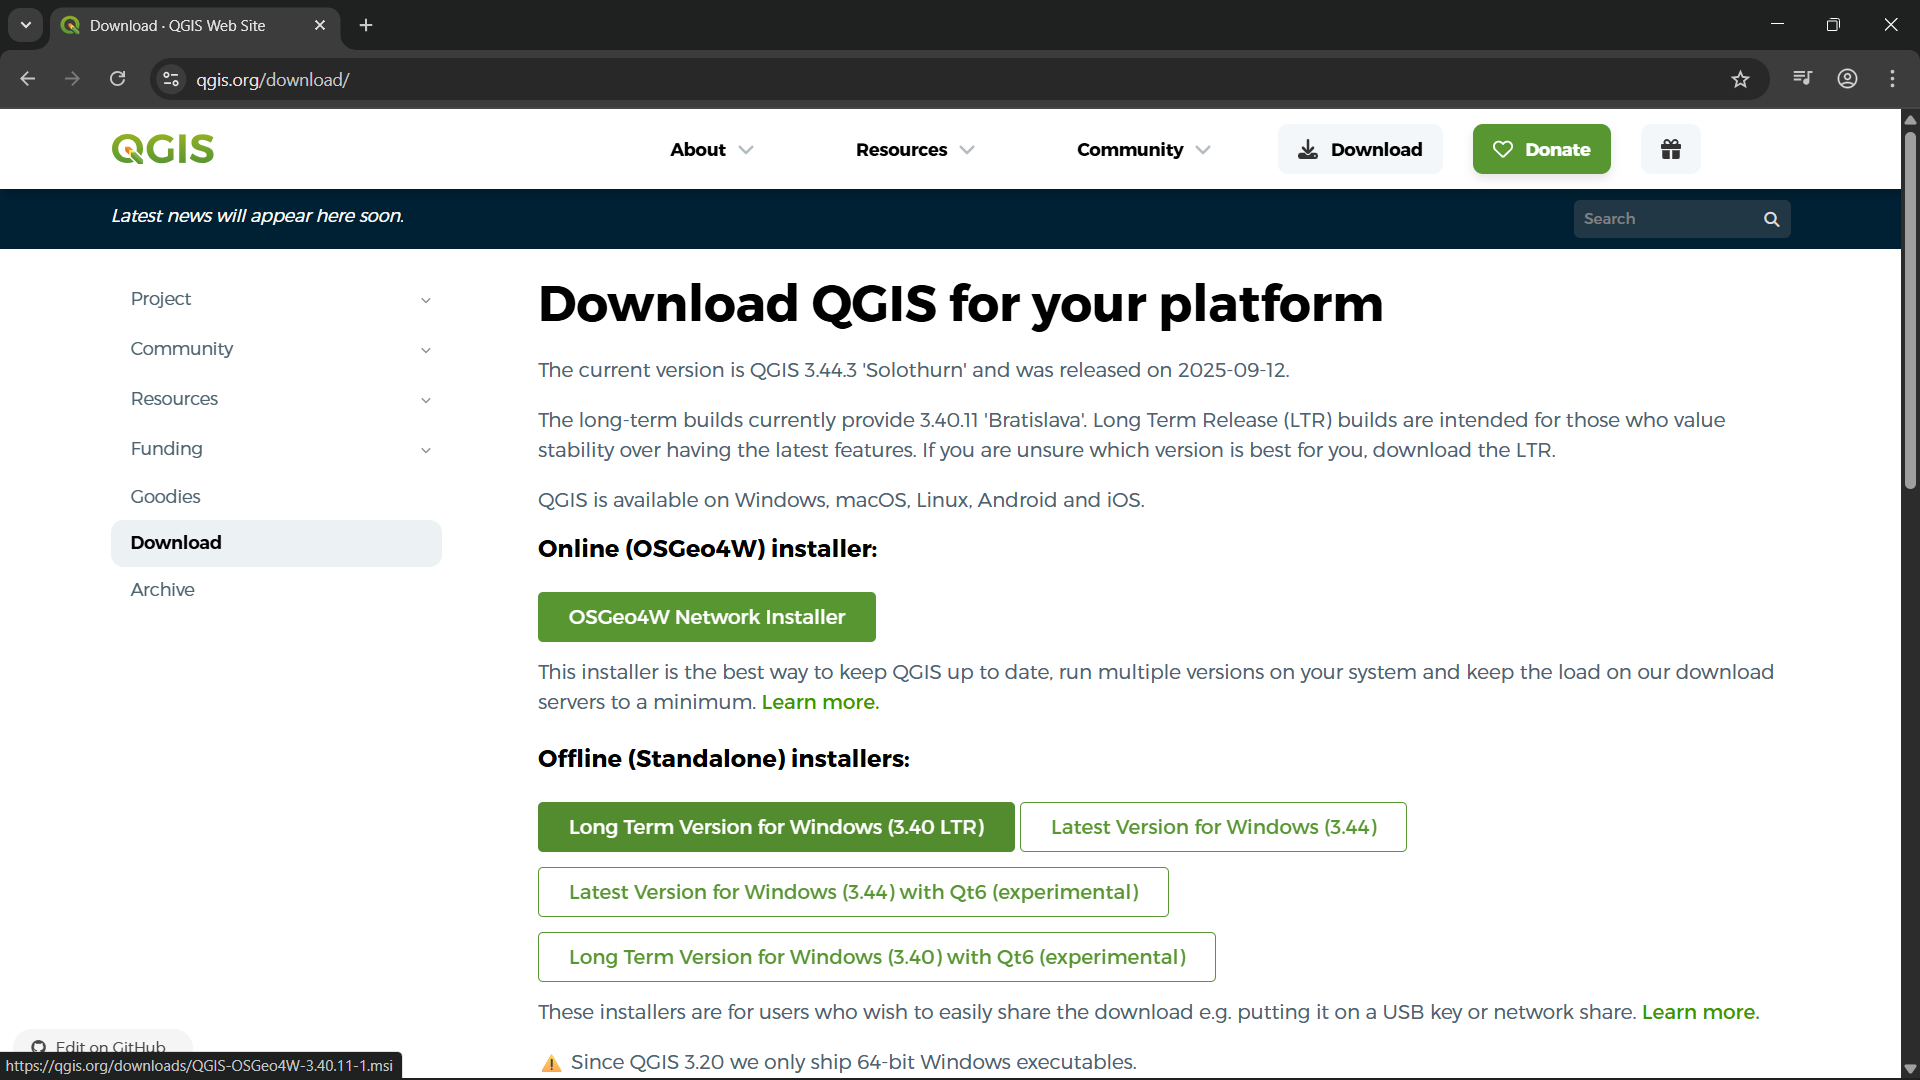
Install QGIS and prepare your workspace for creating professional geographic visualizations.
- Install QGIS from official website (qgis.org)
- Create new project directory for your webmap
- Initialize .shp files for vector data
- Import and process points and lines to make your first map
Create Your First Weather Data Visualization
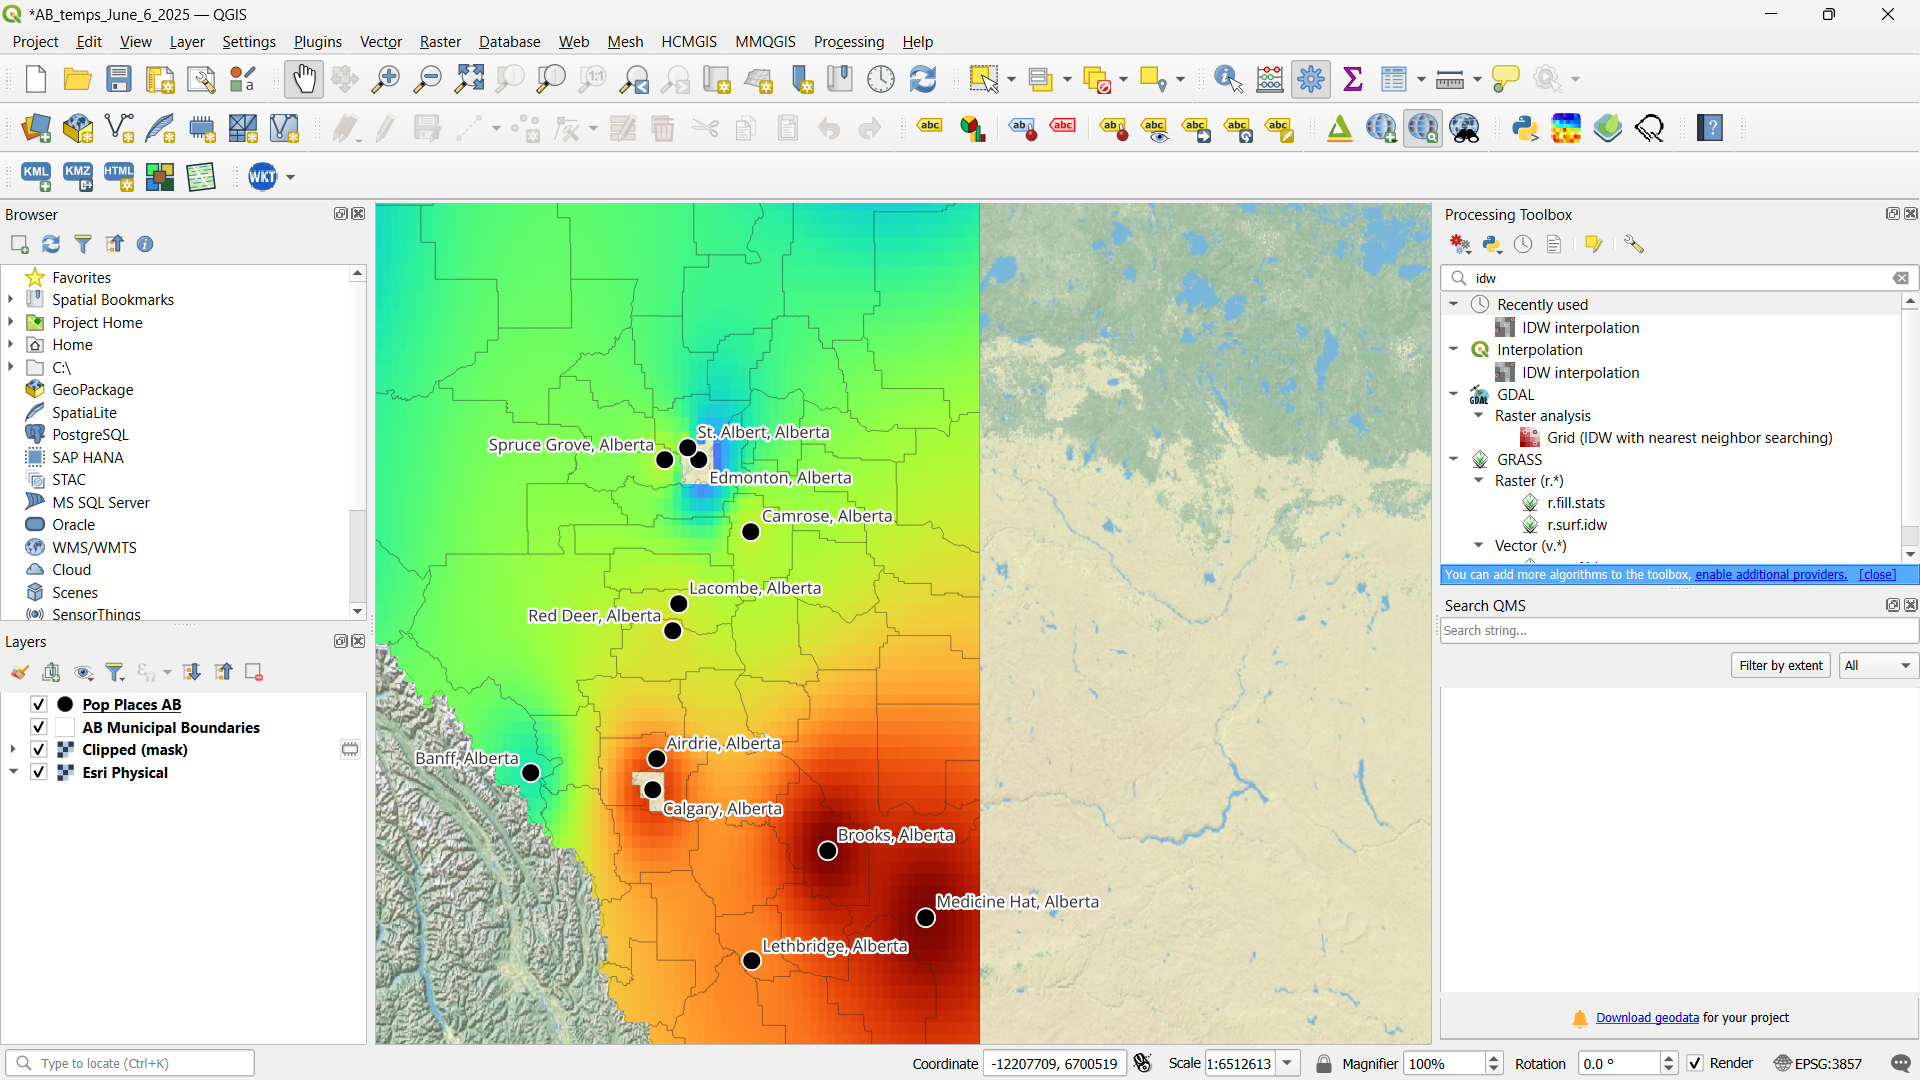
Use QGIS color gradients to show weather data differences across Alberta recording stations.
- Download the Alberta temperature data and municipality boundaries files below
- Apply color gradient to show differences in weather data points
- Use Alberta weather recording stations as data source
- Create the gradient map with professional styling
- Export your completed map to PDF format
Ages 13+: Complete Steps 2, 3, and 4 (70% completion) to enter the prize draw.
Configure Your Interactive Web Map
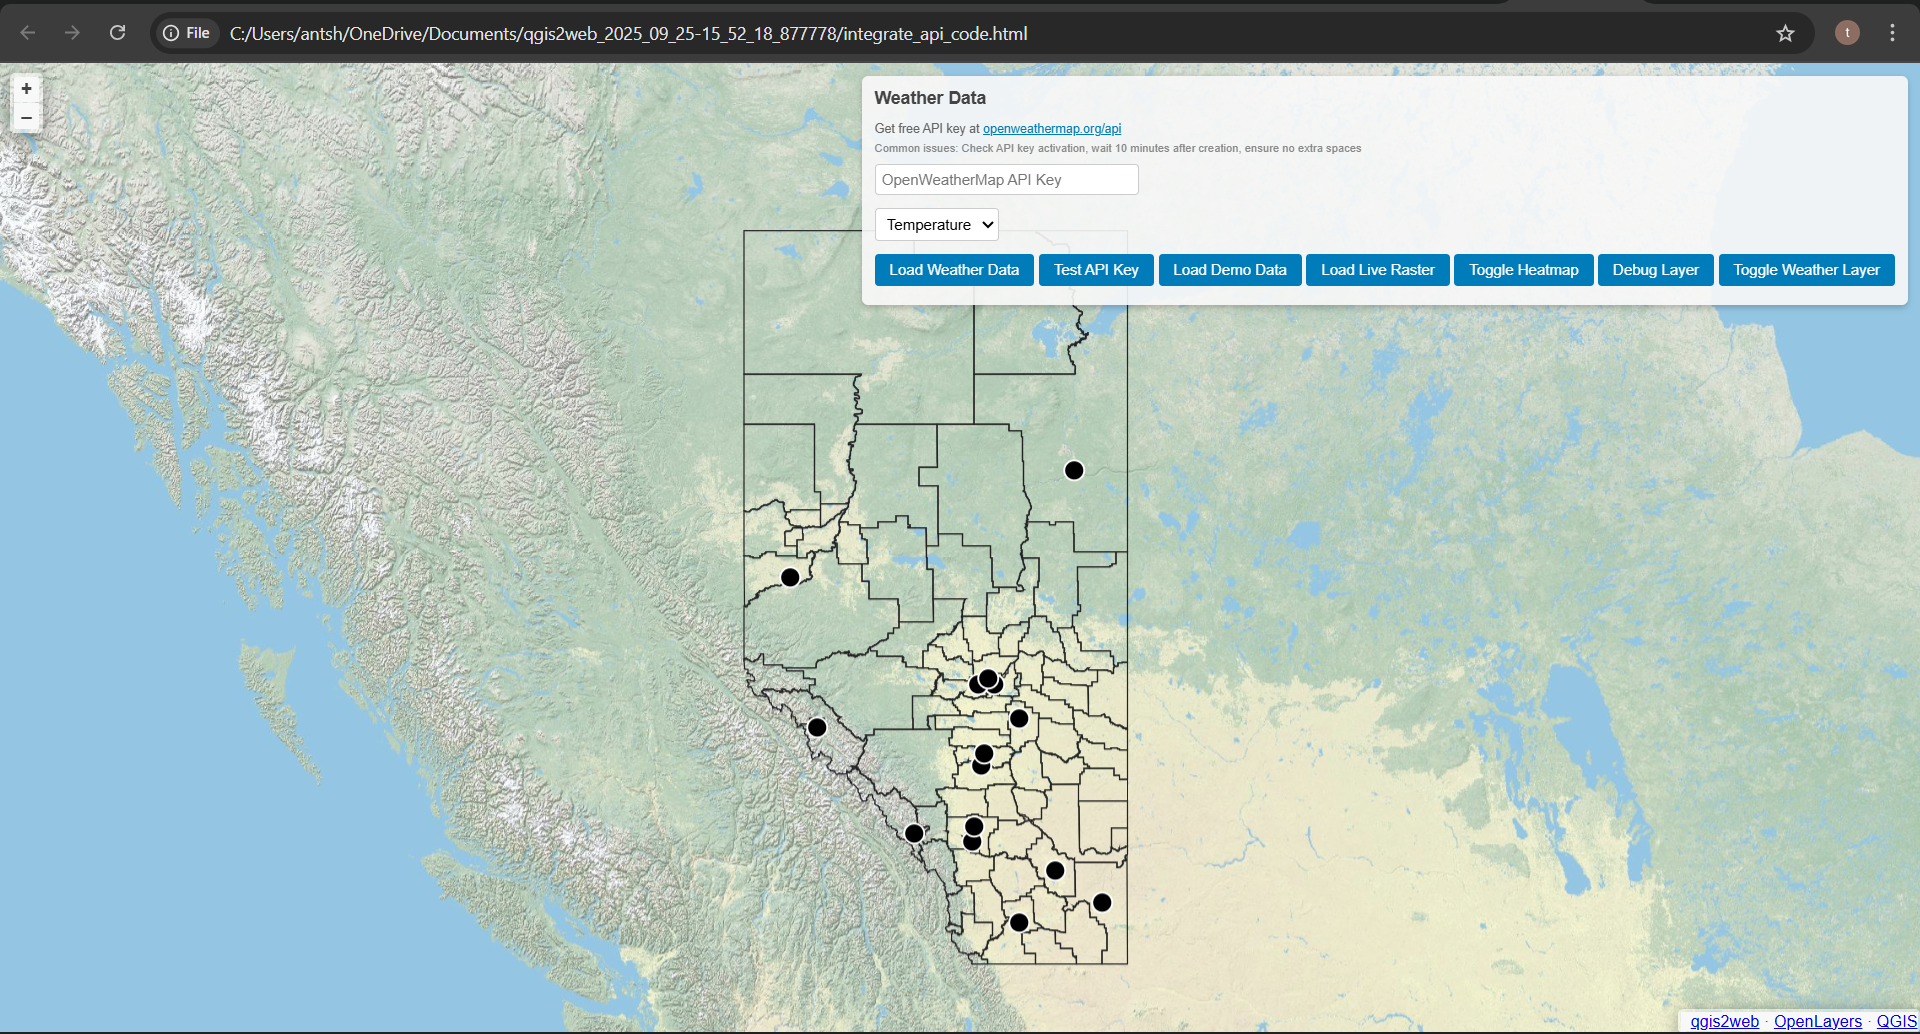
Transform your QGIS project into a live, interactive web application with weather data overlay.
- Use QGIS2Web plugin to export HTML container
- Configure location boundaries and place points
- Sign up for OpenWeatherMap API access
- Apply heatmap visualization over your original map
Microcontroller Integration
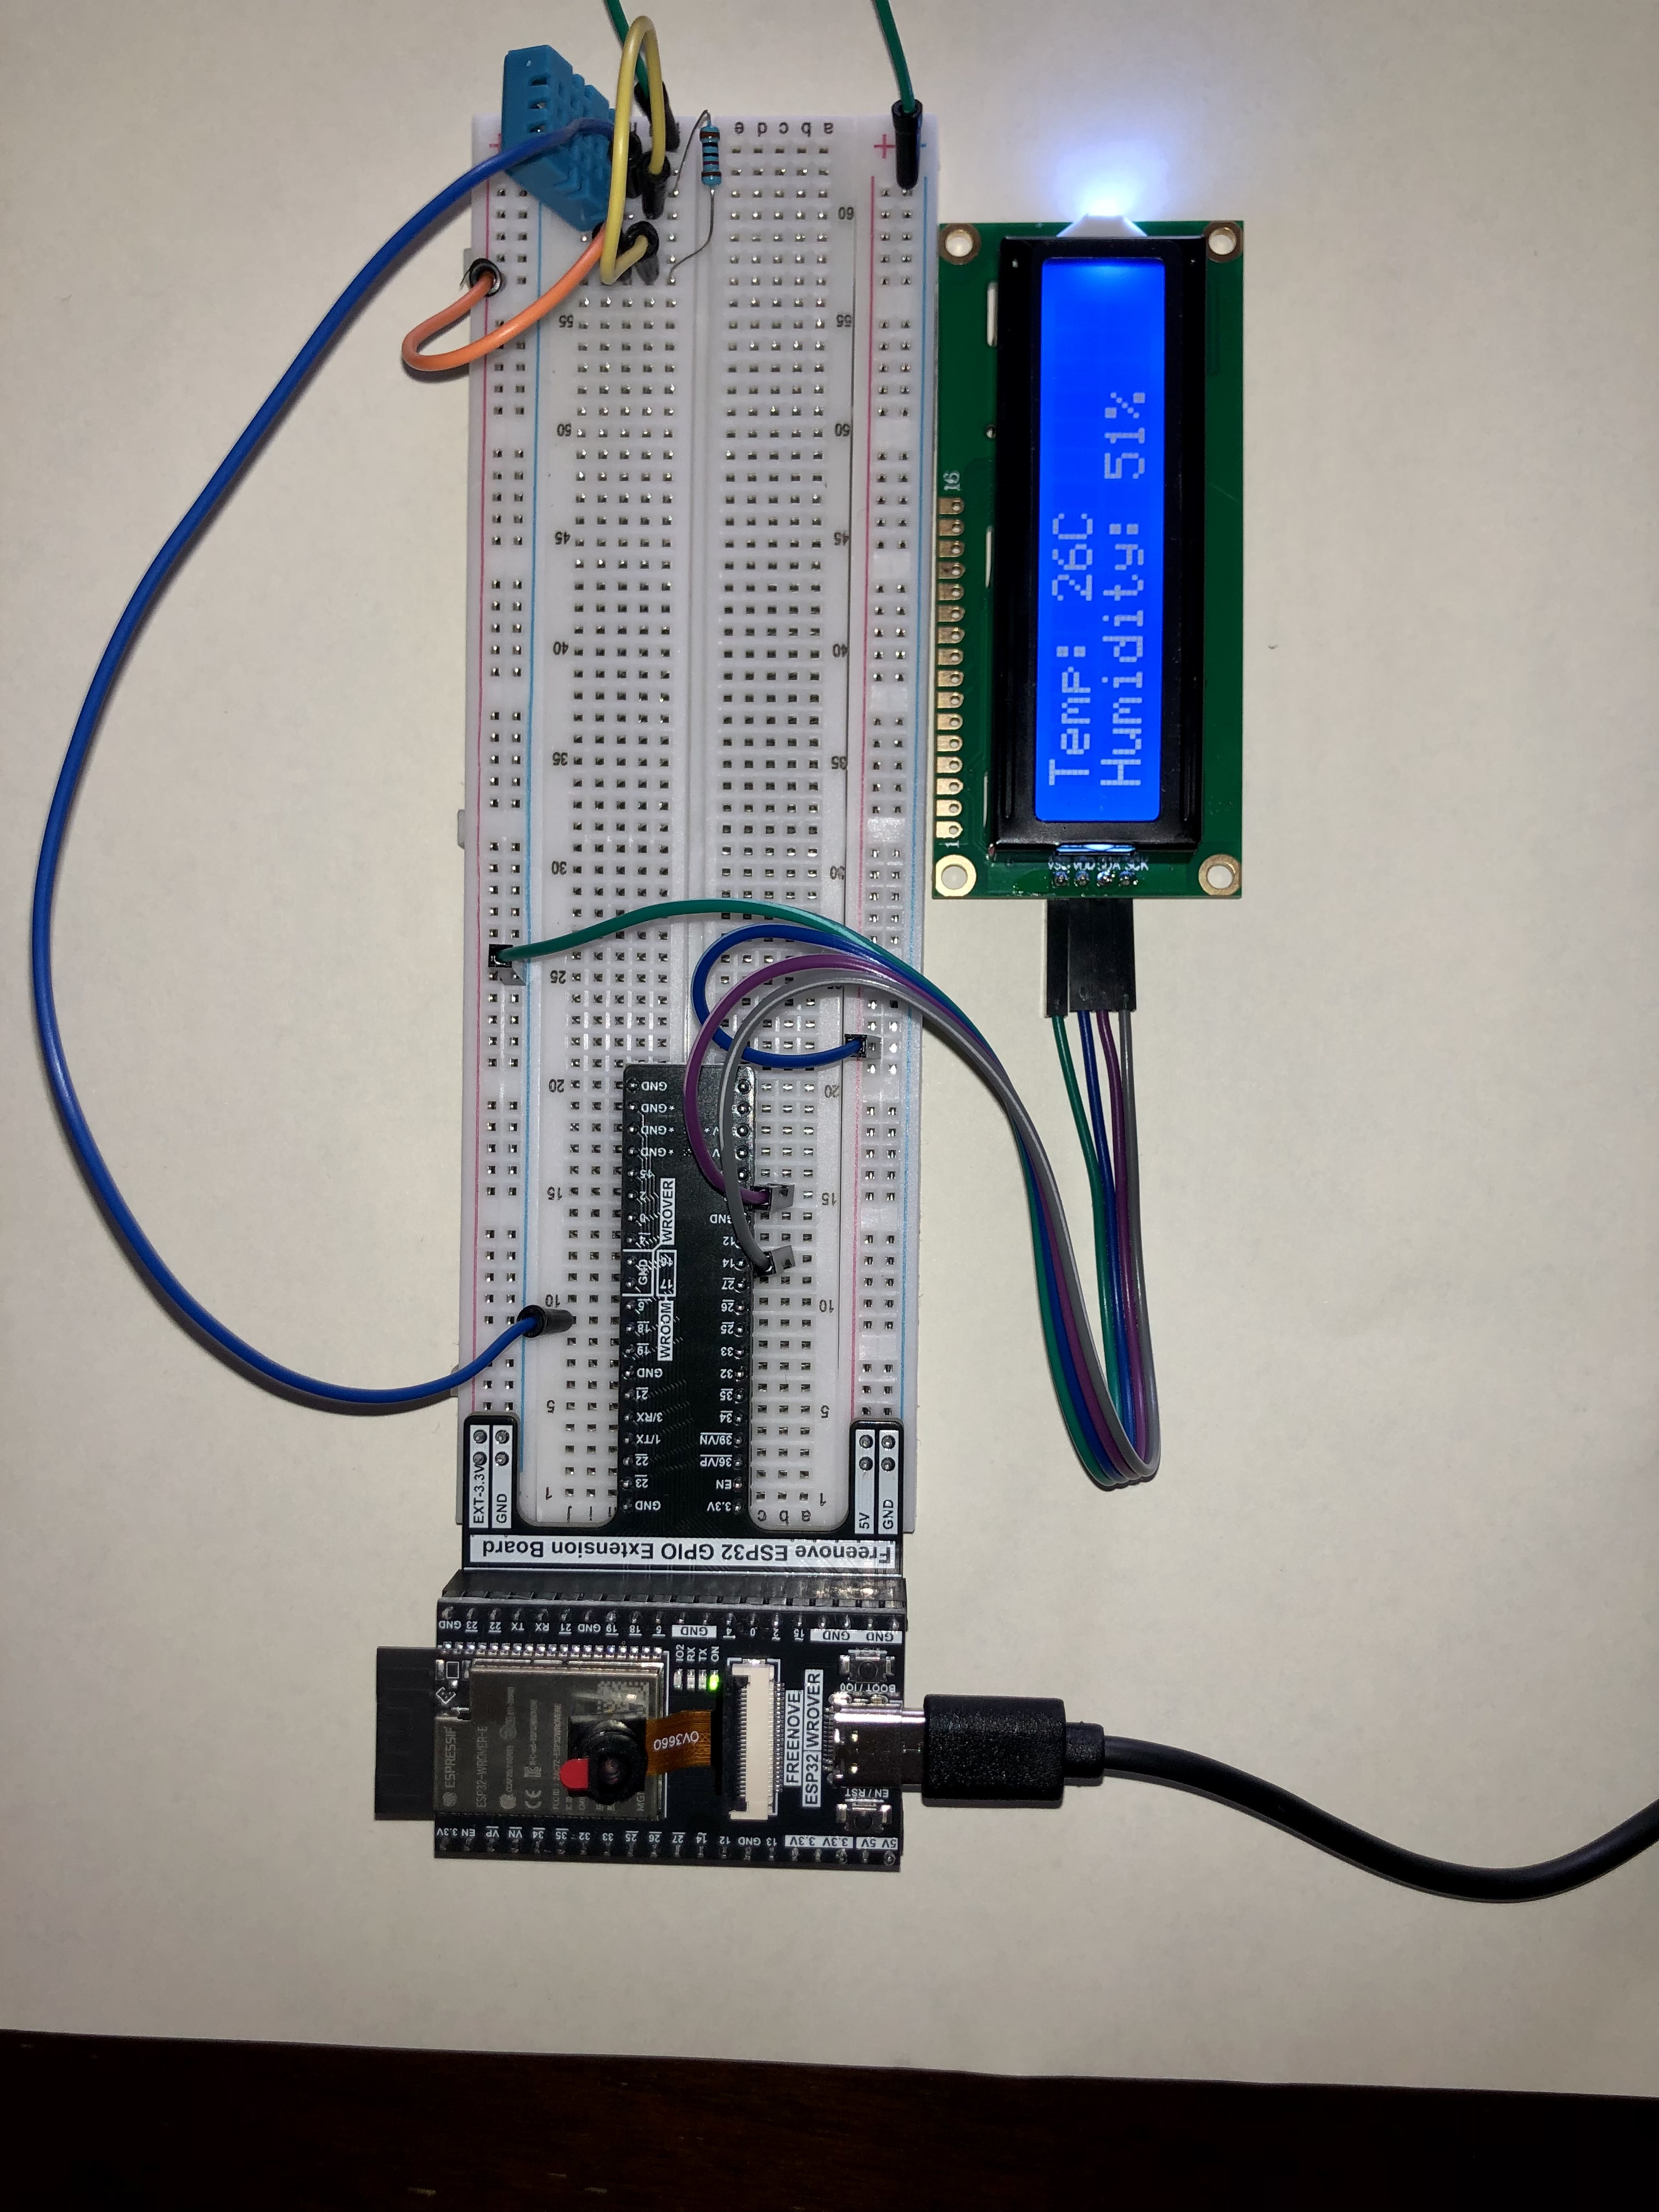
Connect real hardware to your web map for live, local weather data collection and display.
- Unpack microcontroller components: ESP32, breadboard, wires, DHT11 sensor
- Wire DHT11 sensor to ESP32 according to the circuit diagram
- Install required libraries in Thonny IDE
- Upload DHT11 Temperature code to test the sensor connection
- Program ESP32 to create a local web server
- Configure ESP32 DHT11 webserver code in Thonny
- Create ESP32 overlay file for map integration
- Add integration line to your webmap's index.html
- Test real-time data display on your web map
Ages 13+ have completed all required steps. Email your work to enter the prize draw.
Set Up Your Development Environment
Access Google Earth online and prepare your workspace for creating interactive geographic visualizations.
- Access Google Earth online (earth.google.com)
- Create new project directory for your webmap
- Initialize .kml files for geographic data
- Import and process points and lines to make your first map
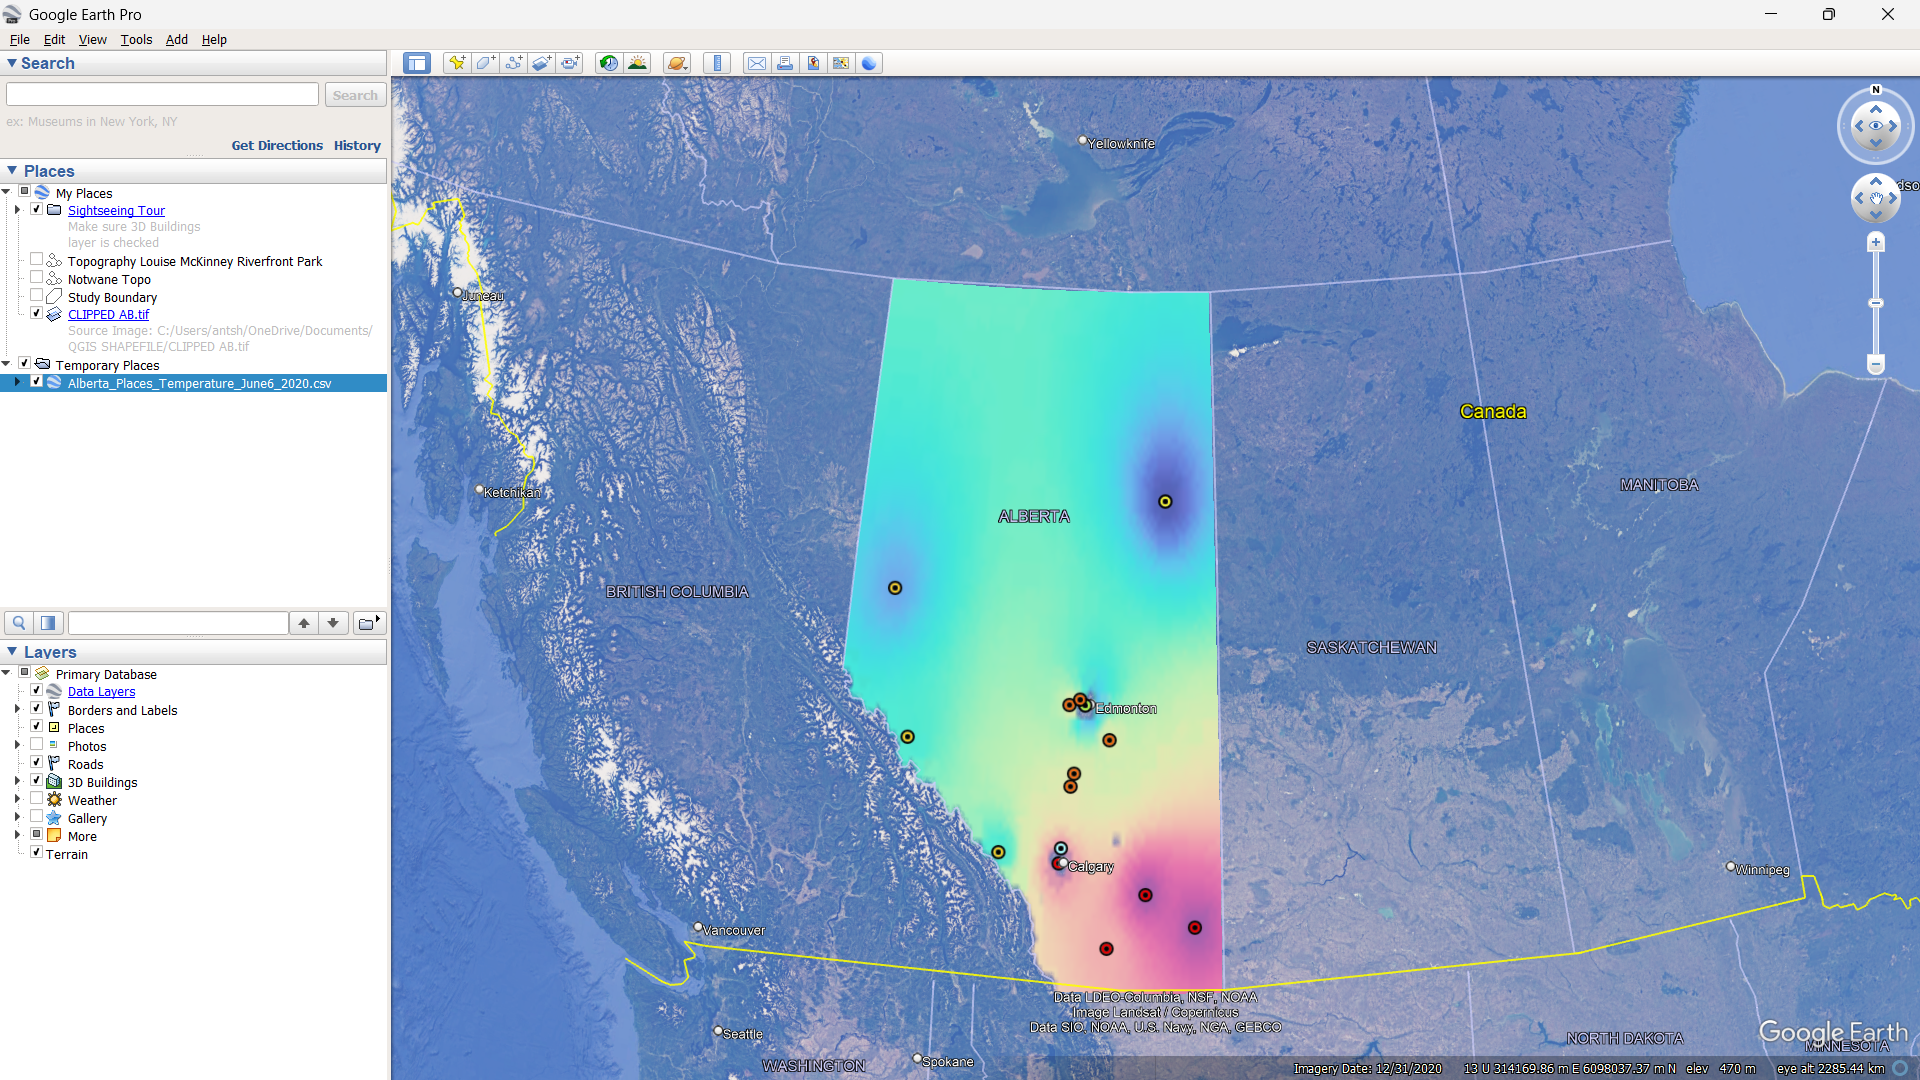
Create Your First Weather Data Visualization
Use Google Earth's styling tools to visualize weather data differences across Alberta recording stations.
- Apply color coding to show differences in weather data points
- Use Alberta weather recording stations as data source
- Create styled markers with weather information
- Export your completed map to KML format
Ages 13+: Complete Steps 2, 3, and 4 (70% completion) to enter the prize draw.
Configure Your Interactive Web Map
Transform your Google Earth project into a live web application with weather data integration.
- Export Google Earth project for web embedding
- Configure location boundaries and place points
- Sign up for OpenWeatherMap API access
- Apply weather data overlay to your Google Earth base map
Microcontroller Integration
Connect real hardware to your web map for live, local weather data collection and display.
- Unpack microcontroller components: ESP32, breadboard, wires, DHT11 sensor
- Wire DHT11 sensor to ESP32 according to the circuit diagram
- Install required libraries in Thonny IDE
- Upload DHT11 Temperature code to test the sensor connection
- Program ESP32 to create a local web server
- Configure ESP32 DHT11 webserver code in Thonny
- Create ESP32 overlay file for map integration
- Add integration line to your webmap's index.html
- Test real-time data display on your web map
Ages 13+ have completed all required steps. Email your work to enter the prize draw.
Bonus Challenge
3D print a creative cover or frame for your local weather map station! Design something unique that protects your hardware while showcasing your project.
- Weather-resistant enclosure with clear display window
- Artistic frame that complements your map's aesthetic
- Modular case with easy access for maintenance
- Creative mounting system for outdoor installation