Live GPS Integration
Track real-time movement data with ESP32 GPS sensor and create animated visualizations
What You'll Need
Understanding GPS Data Structure
Learn how GPS data is stored as CSV and how it works with temporal controllers for creating smooth animations.
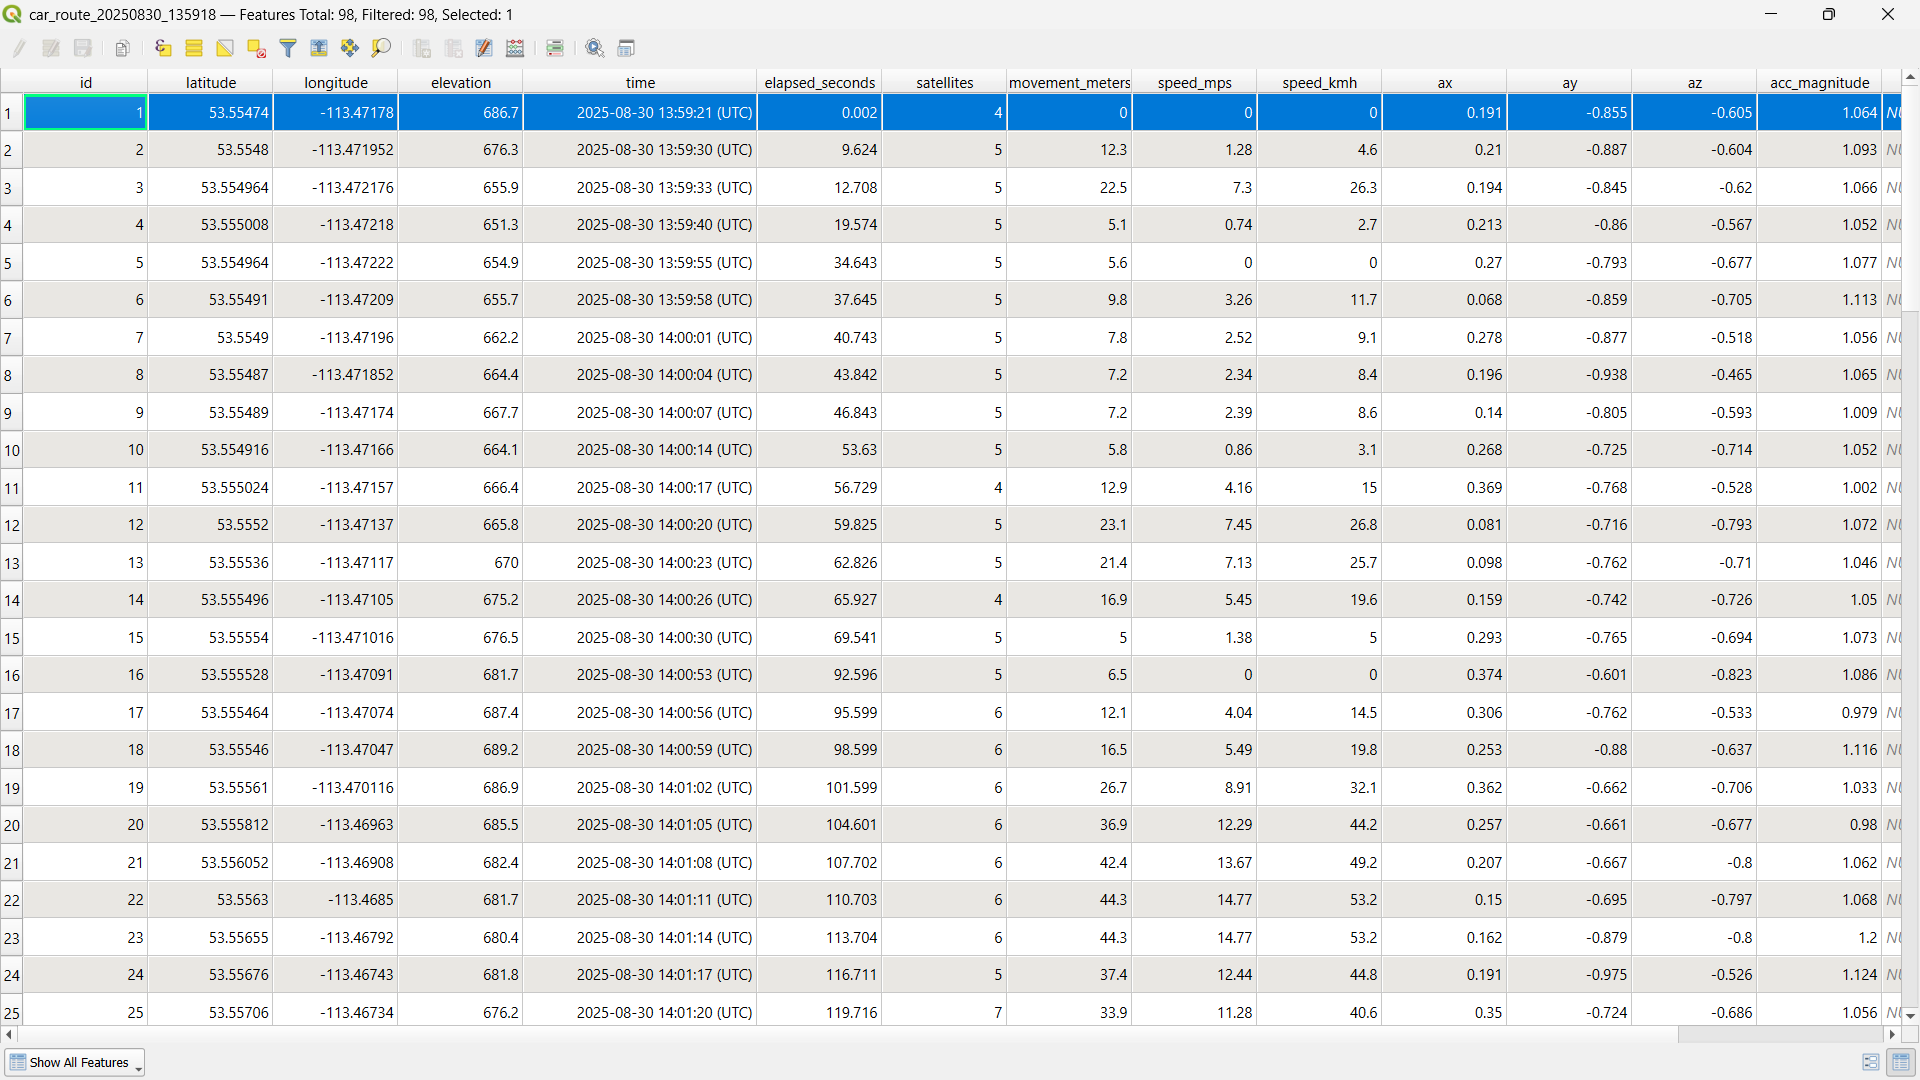
- GPS data is stored in CSV format with timestamp, latitude, longitude, altitude
- CSV structure: timestamp,lat,lng,altitude,speed,heading
- QGIS temporal controller reads CSV data chronologically
- Animation frames are created based on time intervals
- Connect ESP32 + GPS sensor for live data collection
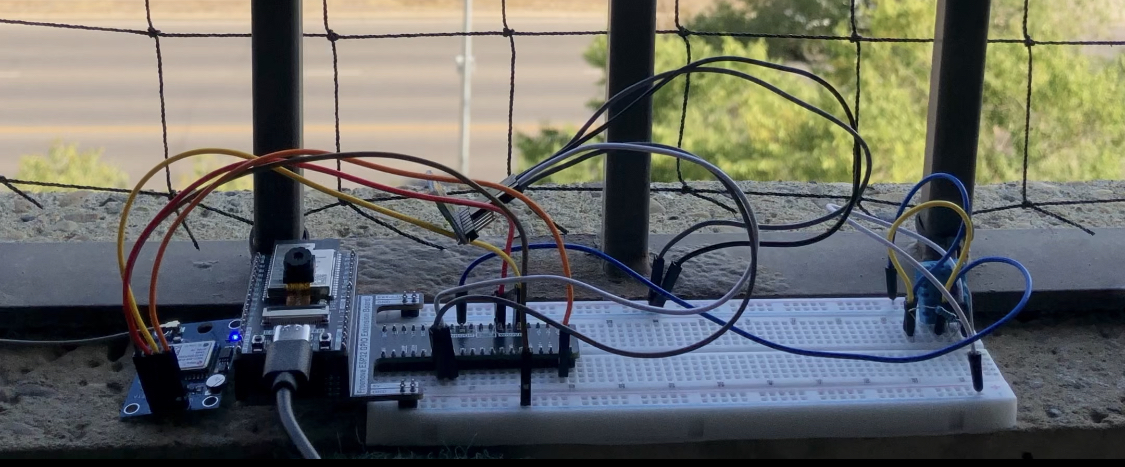
Hardware Setup & Code Preparation
Import GPS tracking code into Thonny IDE and prepare for outdoor data collection with portable setup.
- Import GPS tracking code into Thonny IDE
- Prepare for outdoor connection to reach more satellites
- Set up battery pack for portable operation
- Create self-contained ESP32 enclosure
- Ensure laptop independence for mobile tracking
Data Collection & Visualization
Collect real GPS data and import it into QGIS for temporal controller animations or use our DataInMotion GPS page.
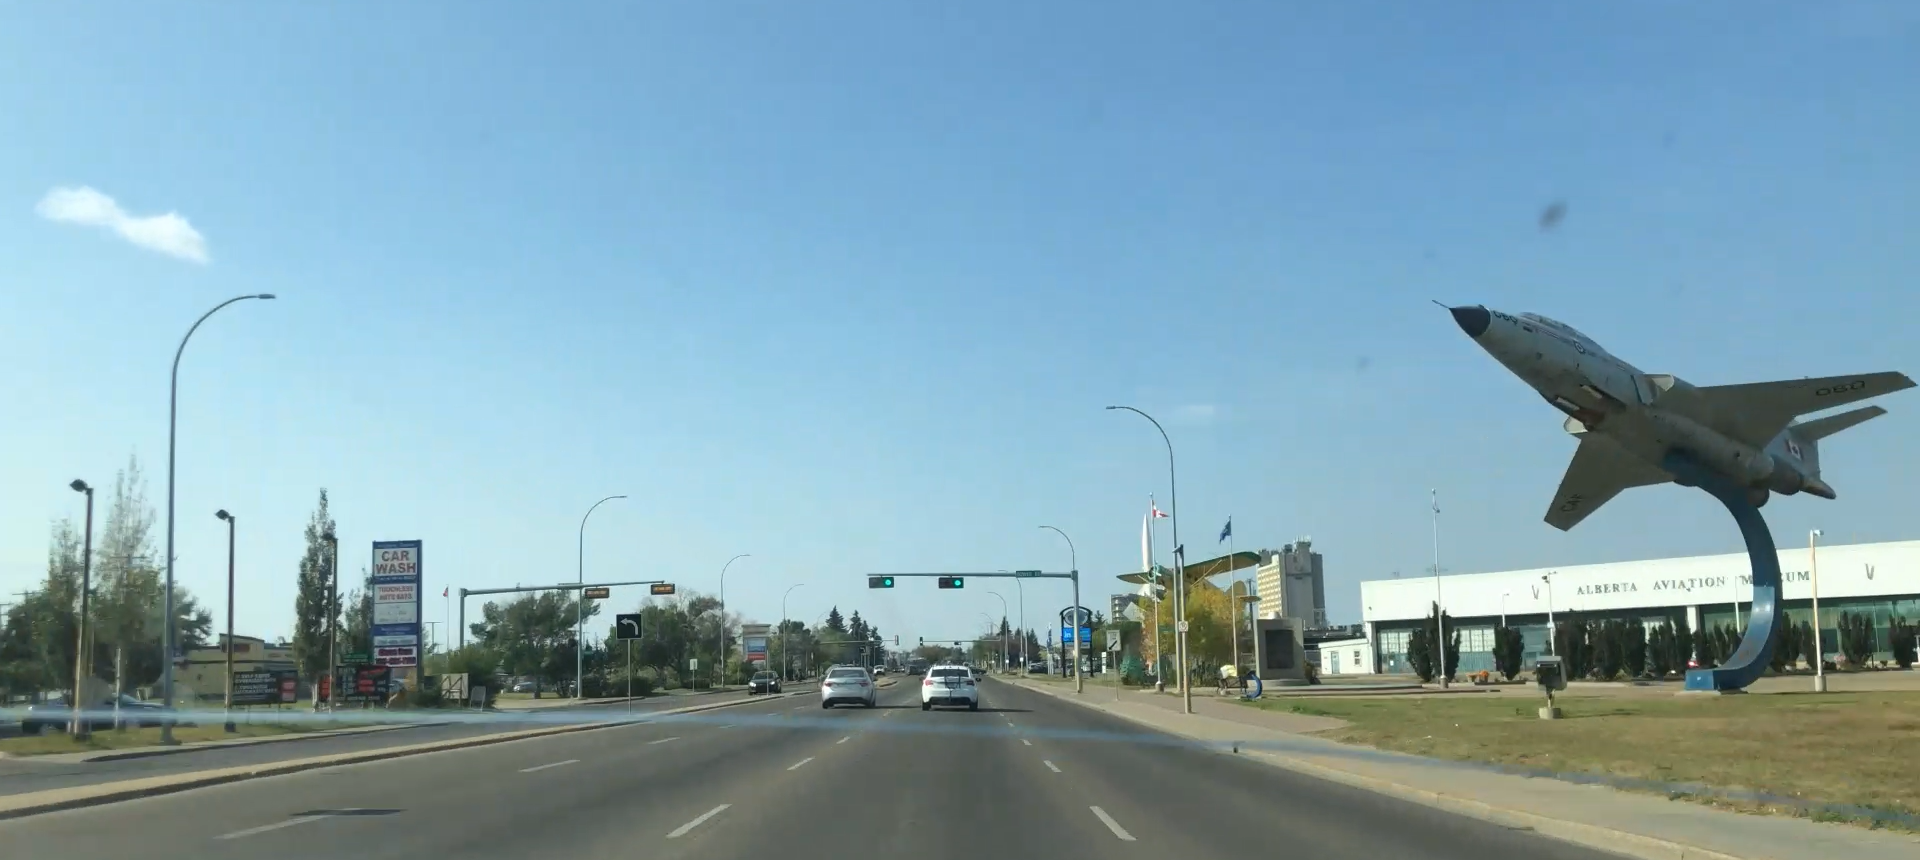
- Collect GPS tracking data during movement
- Export data as CSV with proper timestamp format
- Import CSV data into QGIS for temporal controller
- Configure temporal animation settings
- Play and send collected data for visualization
Understanding GPS Data Structure
Learn how GPS data is stored as CSV and how it works with our DataInMotion GPS page for real-time visualization.
- GPS data is stored in CSV format with timestamp, coordinates
- CSV structure: timestamp,lat,lng,altitude,speed,heading
- DataInMotion GPS page reads CSV data automatically
- Real-time visualization updates as data streams in
- Connect ESP32 + GPS sensor for live data collection
Hardware Setup & Code Preparation
Import GPS tracking code into Thonny IDE and prepare for outdoor data collection with portable setup.
- Import GPS tracking code into Thonny IDE
- Prepare for outdoor connection to reach more satellites
- Set up battery pack for portable operation
- Create self-contained ESP32 enclosure
- Ensure laptop independence for mobile tracking
DataInMotion GPS Visualization
Collect real GPS data and stream it directly to our DataInMotion GPS page for instant web-based visualization.
- Collect GPS tracking data during movement
- Stream data directly to DataInMotion GPS page
- View real-time tracking on web interface
- Export data as CSV for further analysis
- Share live tracking with others via web link
Project Complete!
You've successfully created a live GPS tracking system! Your data can now be visualized in real-time or exported for further analysis.
- Analyze your tracking patterns and movement data
- Create custom visualizations with your GPS data
- Set up automated data collection schedules
- Integrate with other sensors for comprehensive tracking